Bienvenidos en chino
Mobbing-acoso laboral-IRG

Technology of Reduced Additive Foods - 2nd Edition Jim Smith

Technology of Reduced Additive Foods

Table of Contents
1 New animal-derived ingredients
2 New marine-derived ingredients
3 The technology of reduced additive breadmaking
4 Novel food packaging
5 Antimicrobial preservative-reduced foods
6 New plant-derived ingredients
7 Reduced additive brewing and winemaking
8 Food from supplement-fed animals
9 Starter cultures

Cooling Tower: Performance Calculation II Chemical Engineering

This is in continuation of my previous post on this topic. In this part, I will explain the calculation of NTU for cooling towers, yes NTU which is very important & is similar to NTU in absorption towers.

It helps in indentifying the performance, capacity & effciiency of your cooling tower. In next part of this post I will explain How to use these calculations for mesurement of efficiencies, prediction for new conditions etc.

Now we will see the NTU calculation & efficiency of tower, use of NTU method for predictions etc.

Step-1

First consider the cooling water exit temperature ‘twex’ in column A in excel sheet so i.e. 35°C in this case. All the data is given in Part-I...So Check it First.

Put h’ in column B which is the enthalpy of saturated air at twex and can be calculated by the equation

h’=9.446443x10⁻¹³x(twex^8)-1.433603766x10⁻¹⁰x(twex^7)+5.39506924*10-9(twex ^6)+3.02962638*10-7(twex^5)-0.0000272854755*(B7^4)+0.00096596975*(B7^3)-0.005340108*(B7^2)+0.458708485*B7+2.219286635

Put tawet in column C starting with actual wet bulb temperature of entering air, which is 30°C in this case.

Put w as absolute humidity at tawet in column D that is calculated from the same formula as shown in Part-I of this post.

Put hcal as humidity at tawet using the formula given above for h’ in column E.

Put ha as humidity at actual wet bulb temperature of entering air, which is 30°C in this case. Yes, that means initially in the first row of calculation sheet hcal & ha will be same. This is in column F.

Now put calculation of difference of h’ – ha in column G.

Step-2

In first row G will be automatically zero.
Now in second row consider
twex 2 = (Twin – Twex)/19 + twex 1
i.e. twex 2 = (44 – 35 ) / 19 + 35
= 0.474 + 35 = 35.474°C

Copy this formula in column A for next 19 rows. This gives you incremental evaluation of tower step by step along the total tower height from 35° at exit at bottom to 44° at inlet at the top.

Copy h’ formula in column B for the same no of rows.

Step-3

Now put any assumed figure for tawet in column C, w in column D, hcal in column E.

Now calculation for ha will change which will come from actual L/G ratio of tower calculated in Part-I.

Use the following formula for ha in second row onwards.

ha 2 = ha1 + L/G * (twex 2 - twex 1) + (w 2 – w 1) / 1000 * twex 1
= ha1 + 1.715 * (35.474 – 35.00) + (w 2 – w 1) / 1000 * 35.0

Based on other figures it will vary.

Now since you have assumed tawet, hcal will be different from ha. Put this difference in next column G.

Now either change tawet manually to make the difference Zero in column G or use goal seek from excel. This will give you tawet, which is supposed to be the actual wet bulb temperature of air exiting from the tower at the top finally.

This will complete first part of NTU calculation after completing all the rows.

Step-4

Now in next column i.e. H; put (h’ – ha) value which is Column B – Column F and copy it down till the last row.

Put reciprocal of column H in column I. This will give you 1/ (h’ – ha) value and copy it down till the last row.

Now in next column J, leave first row blank & start from second row where you should put average of first & second row in column I. This will give you average of 1 / (h’ – ha) for first & second value. Copy this formula also down till the end of rows.

Step-5

Now in column K, put NTUL as calculated below (From second row as column J starts from second row).

NTUL = Column J x (twex 2 - twex 1)= Column J x (35.474 – 35.0)
Copy this formula in all rows.

In column L, put progressive summation of NTUL calculated in column K i.e. in each row of column L, use previous row of column L + same row of column K.

This value at the end of last row will give your towers total NTU for liquid side.

Step-6

Repeat all calculations in next two columns for NTUG similar to Step-5 above and find out final value of gas transfer units. The only difference is to use the following formula to calculate NTUG in column M.

NTUG = Column J x (ha 2 - ha 1) ha is in column F.

Use progressive sum again in column N.


Fuente: Chemical Professionals

Optimización de Torres de Enfriamiento Ingeniería Química

Torres enfriamiento

Función
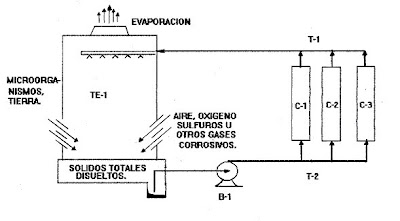
Las Torres de Enfriamiento llevan a cabo la transferencia de calor entre las corrientes de agua y aire con la finalidad de disipar el calor a la atmósfera; el costo de operación de una torre de enfriamiento estará en función del costo de transferencia de calor del agua al aire.

Maximiza la cantidad de calor liberado a la atmósfera por unidad de costo de operación invertido. Basado en el control de las temperaturas de suministros y retorno de agua.

Procesos

Las variables a manipular para lograr el control óptimo de temperaturas, son el flujo de aire y agua; la manipulación de esos flujos pueden llevarse a cabo mediante el uso de variadores, tanto en las bombas de carga, como en los ventiladores de enfriamiento.

Funcionamiento

En los ventiladores es necesario conocer el punto de suministro de agua a la temperatura mínima económica, la cual está en función de la temperatura de bulbos húmedo (twb) del aire; la torre de enfriamiento no puede generar agua a una temperatura menor a esta, pero puede aproximarse.

La aproximación es la diferencia de temperatura de bulbos húmedo (twb) del aire y la temperatura del agua a la salida de la torre. Cuando el diferencial de temperatura se incrementa, los costos de operación de la torre de enfriamiento ventilación y bombas se ven igualmente incrementados.

Fuente: EmersonProcess

Cooling Tower: Performance Calculation I Chemical Engineering

Cooling Tower

I am invariably finding many hits on cooling tower capacity & performance calculation and related queries. Therefore, I have decided to include the detailed calculation procedure in order to enable many students & process engineers who are interested in improving cooling towers performance by following these simple steps.If you have any query, kindly post them in the comments section. I’ll try my level best to answer those queries as soon as possible. First you should collect all the data as given below. Be sure that the data collected for these temperatures is most accurate because of lower absolute level of generally ~40°C average temperatures, an error of 0.5°C due to manual data collection & judgment will cause more than 1.2% error in the result at one calculation. Repeating such errors may result in cumulative errors of more than 10% in totality giving you totally absurd results.So the basic point is that collect the data on regular basis, keep a watch to have a feel of real values & then proceed.

Actual Datag

Cooling water flow rate - 4134 M3/hr
Cooling water inlet Temp - 44.0 °C
Cooling water exit Temp - 35.0 °C
Inlet air-dry bulb - 38.8 °C
Exit air-wet bulb - 40.7 °C
Exit air-dry bulb - 42.0 °C

Now follow step by step procedure for the calculation.

Step-1

Calculate waterside actual heat load, which is as below
Qw = 4134 x 1000 x (44 – 35) / 1000000= 37.21 Gcal/Hr

Step-2

Calculate absolute humidity at wet bulb of inlet air, which is at 30°C in this case. This is a function of wet bulb temperature only.

The equation for the same is
1.4478310678E-10*(Tw^7)-2.6920*10e-8*(Tw^6)+1.99053*10e-6*(Tw^5)-6.65614*10e-5*(Tw^4)+0.00131879344*(Tw^3)+0.00125483272*(Tw^2)+0.291649083*Tw+3.802441

Where Tw is wet bulb temperature in °C.
So, H1 = 27.29 Kg/ ‘000Kg of dry air

Step-3

Calculate absolute humidity at dry bulb of inlet air, which is at 38.8°C in this case. It will give you saturation level of humidity, say H2.

Step-4

Find out &% Saturation. Of course it can be done from Psychometric charts but then you wont be able to use powerful Excel Tool for simulation of your cooling tower that’s why these equations are generated.

You can also use any good Excel Add-IN for Psycho properties if available.

Here, it will be %Sat = H1/H2

Step-5

Based on % Saturation find out the enthalpy content of moist air at inlet condition. Again I did it using self-developed equations ~10 years back.

I found it to be Hin = 26.196 Kcal/Kg of wet air.

Step-6

Similarly find out the moist air enthalpy at exit condition, which is

Hex = 41.630 Kcal/Kg of wet air

Step-7

Similarly, find out the absolute humidity at wet bulb for exit condition, which is 50.74 Kg/ ‘000 kg of dry air in this case.

Step-8

Calculate airflow based on heat load and enthalpy difference, which shall be as below

A = 4134000 x (44-35)/(41.630 – 26.196)= 2410652 Kg/hr

Now based on Absolute Humidity difference, calculate amount of water evaporated as below

W = 2756000 X (50.74 – 27.29)/1000= 64654 Kg/hr

Step-9

Now heat required for evaporation of this water can be calculated based on average latent heat of water evaporation at the inlet & exit temperature.

Average water temperature = 39.5 °C
Latent heat = 575.33 Kcal/Kg

Hev = 64654 x 575.33= 37.20 Gcal/Hr

This is matching with the heat load of waterside hence, calculation is correct due to accurate temperature measurements.

So L/G comes out to be = 1.715 in this case.


Starch in Food Structure, function and applications
Ann-Charlotte Eliasson

Starch in Food

Table of Contents

1 Plant starch synthesis
J. Preiss, Michigan State University, USA
1.1 Introduction: localization and function of starch in plants
1.2 Starch synthesis: enzyme reactions in plants and algae
and glycogen synthesis in cyanobacteria
1.3 Properties of plant glucan synthesizing enzymes: ADP-glucosepyrophosphorylase
1.4 Properties of plant glucan synthesizing enzymes: starch synthase
1.5 Properties of plant glucan synthesizing enzymes: branching enzymes
1.6 Initiation of starch synthesis using a glucosyl-protein
1.7 Locating starch synthesis in plants: the plastid
1.8 In vivo synthesis of amylopectin
1.9 Regulating starch synthesis in plants
1.10 References
2 Analysing starch structure
E. Bertoft, A Ê bo Akademi University, Finland
2.1 Introduction: characterising structures of starch components
2.2 Fractionation of starch
2.3 Analysis of amylose
2.4 Analysis of amylopectin structure
2.5 Analysis of intermediate materials
2.6 Analysis of chemically modified starches
2.7 Future trends
2.8 Sources of further information and advice
2.9 References
3 Starch bioengineering
A. Blennow, The Royal Agricultural and Veterinary University, Denmark
3.1 Introduction: the importance of starch
3.2 Technologies for genetic modification and starch profiling
3.3 Improving starch yield and structure
3.4 Physical and chemical properties of modified starches
3.5 Functionality and uses of modified starches in food processing
3.6 Ensuring successful modification of starch
3.7 Future trends
3.8 References
4 Starch-acting enzymes
D. P. Butler, Marc J. E C. van der Maarel and P. A. M. Steeneken, TNO Nutrition and Food Research Institute, The Netherlands
4.1 Introduction: the importance of enzymes
4.2 Using enzymes to modify starch
4.3 Developing starch-modifying enzymes for food processing applications
4.4 Future trends
4.5 References
5 Understanding starch structure and functionality
A. M. Donald, University of Cambridge, UK
5.1 Introduction: overview of packing at different lengthscales
5.2 The effect of amylopectin chain architecture on packing
5.3 Improving packing within starch granules
5.4 The gelatinisation process
5.5 Food processing: implications of starch granule structure
5.6 Conclusions and future trends
5.7 Sources of further information and advice
5.8 References
6 Measuring starch in food
M Peris-Tortajada, Polytechnic University of Valencia, Spain
6.1 Introduction
6.2 Sample preparation
6.3 Methods of analysing starch in food
6.4 Determining starch in food: recent technological developments
6.5 Future trends
6.6 Sources of further information and advice
6.7 References
Part II Sources of starch
7 The functionality of wheat starch
H. Cornell, RMIT University, Australia
7.1 Introduction: manufacture of wheat starch for the food industry
7.2 Granular and molecular structure of wheat starch
7.3 Functionality of wheat starch: granules, films and pastes
7.4 Rheological properties of starch pastes and gels
7.5 Improving and chemically modifying wheat starch for use in the food industry
7.6 Wheat starch syrups
7.7 Analysing starch-based products
7.8 Future trends
7.9 Sources of further information and advice
7.10 References
8 Developments in potato starches
W. Bergthaller, Federal Centre for Nutrition and Food, Germany
8.1 Introduction
8.2 Components and rheological properties of potato starch
8.3 Techniques for producing potato starch
8.4 Improving the functionality of potato starch for use in the food industry
8.5 Future trends
8.6 References
9 The functionality of rice starch
J. Bao and C. J. Bergman, Texas A&M University, USA
9.1 Introduction
9.2 Rice flour and starch as food ingredient
9.3 Constituents of rice starch
9.4 Structure and functionality of rice starch
9.5 Gelatinization and the structure of rice starch
9.6 Retrogradation and other properties of rice starch
9.7 Improving rice starch functionality for food processing applications
9.8 Future trends
9.9 Sources of further information and advice
9.10 References
10 New corn starches
P. J. White and A. Tziotis, Iowa State University, USA
10.1 Introduction: the use of corn starch in food processing
10.2 Improving the functionality of corn starch for food processing applications: natural corn endosperm mutants
10.3 Chemically modifying corn starches for use in the food industry
10.4 Genetically modifying corn starches for use in the food industry
10.5 Future trends
10.6 Sources of further information and advice
10.7 References
11 Tropical sources of starch
S. N. Moorthy, Central Tuber Crops Research Institute, India
11.1 Introduction: tropical sources of starch
11.2 Characteristics and properties of cassava starch
11.3 Characteristics and properties of sweet potato starch
11.4 Characteristics and properties of yam and aroid starches
11.5 Characteristics and properties of other minor root starches
11.6 Modifying `tropical' starches for use in the food industry
11.7 Future trends
11.8 References
Part III Applications
12 Starch as an ingredient: manufacture and applications
P. Taggart, National Starch and Chemical, UK
12.1 Introduction
12.2 Manufacture
12.3 Structure
12.4 Modifications
12.5 Technical data
12.6 Uses and applications
12.7 Regulatory status: European label declarations
12.8 Acknowledgements
12.9 Bibliography
13 Utilizing starches in product development
T. Luallen, Cargill Inc., USA
13.1 Introduction
13.2 Components of starch
13.3 Food applications for natural and modified starches
13.4 Methods of starch selection
13.5 Factors affecting starch in food products
13.6 Using the functional properties of starch to enhance food products
13.7 References
14 Modified starches and the stability of frozen foods
H. D. Goff, University of Guelph, Canada
14.1 Introduction
14.2 The structure and stability of frozen foods
14.3 The role of modified starch in stabilizing frozen foods
14.4 Future trends
14.5 Sources of further information and advice
14.6 References
15 Starch-lipid interactions and their relevance in food products
A-C. Eliasson and M. Wahlgren, Lund University, Sweden
15.1 Introduction
15.2 The structure and properties of the starch-lipid complex
15.3 Analysis of starch: lipids and emulsifiers
15.4 The effect of lipids on starch behaviour
15.5 Enzymatic degradation of amylose-lipid complexes
15.6 Future trends
15.7 References
16 Starch-based microencapsulation
P. Forssell, VTT Biotechnology, Finland
16.1 Introduction: using microencapsulation in food processing
16.2 Using starch in microencapsulation: starch hydrolysates, derivatives, polymers and granules
16.3 Starch-based shell matrices for food ingredients
16.4 Future trends
16.5 References
Part IV Starch and health
17 Development of a range of industrialised cereal-based foodstuffs high in slowly digestible starch
V. Lang, Danone Vitapole, France
17.1 Introduction
17.2 Characteristics and properties of starch and starchy foods
17.3 Low G I diets and their associated health benefits
17.4 Case study: low glycaemic index, high slowly digestible starch plain biscuits, the EDPÕ (`Long-lasting energy') range developed by Danone, Vitapole
17.5 Future trends
17.6 Sources of further information and advice
17.7 Acknowledgements
17.8 References
18 Starch: physical and mental performance
F. Brouns, Cerestar Vilvoorde R & D Centre, Belgium and University of Maastricht, Netherlands and L. Dye, University of Leeds, England
18.1 Introduction
18.2 Physical performance: energy requirements, delivery and availability
18.3 Mental performance: the effects of glucose
18.4 Mental performance: the effects of CHO and glucose during the day
18.5 Future trends
18.6 References
19 Detecting nutritional starch fractions
K. Englyst and H. Englyst, Englyst Carbohydrates, UK
19.1 Introduction
19.2 Methods of determining RAG, SAG and RS fractions
19.3 Quality control and troubleshooting
19.4 Carbohydrate bioavailability data for selected foods
19.5 Conclusion and future trends
19.6 Acknowledgement
19.7 References
20 Resistant starch
M. Champ, INRA-UFDNH/CRNH, France
20.1 Introduction
20.2 Effects of resistant starch on the digestive system
20.3 Improving the functional effects of resistant starch
20.4 Future trends
20.5 Sources of further information and advice
20.6 References
21 Analysing starch digestion
R. E. Wachters-Hagedoorn, M. G. Priebe and R. J. Vonk, University Hospital Groningen, The Netherlands
21.1 Introduction
21.2 Starch and the prevention of hypo- and hyperglycemia
21.3 The determinants of the rate of absorption of starch-derived glucose
21.4 Techniques for monitoring starch digestion
21.5 Current applications of slowly available starch and the prevention of hyper- and hypoglycemia
21.6 Future trends
21.7 Sources of further information and advice
21.8 References